ACCESS-NRI Model Live Diagnostics
What is Model Live Diagnostics?
Model Live Diagnostics is a simple, accessible and easy to use Jupter-based framework for the ACCESS modelling community to monitor, visualise and evaluate the behaviour of models in real time (live) while they run on Gadi.
In addition to monitoring a live model, the package also provides the functionality to load, visualise and compare legacy ACCESS model data with the live model.
For more information and tutorials, please visit Model Diagnostics Documentation
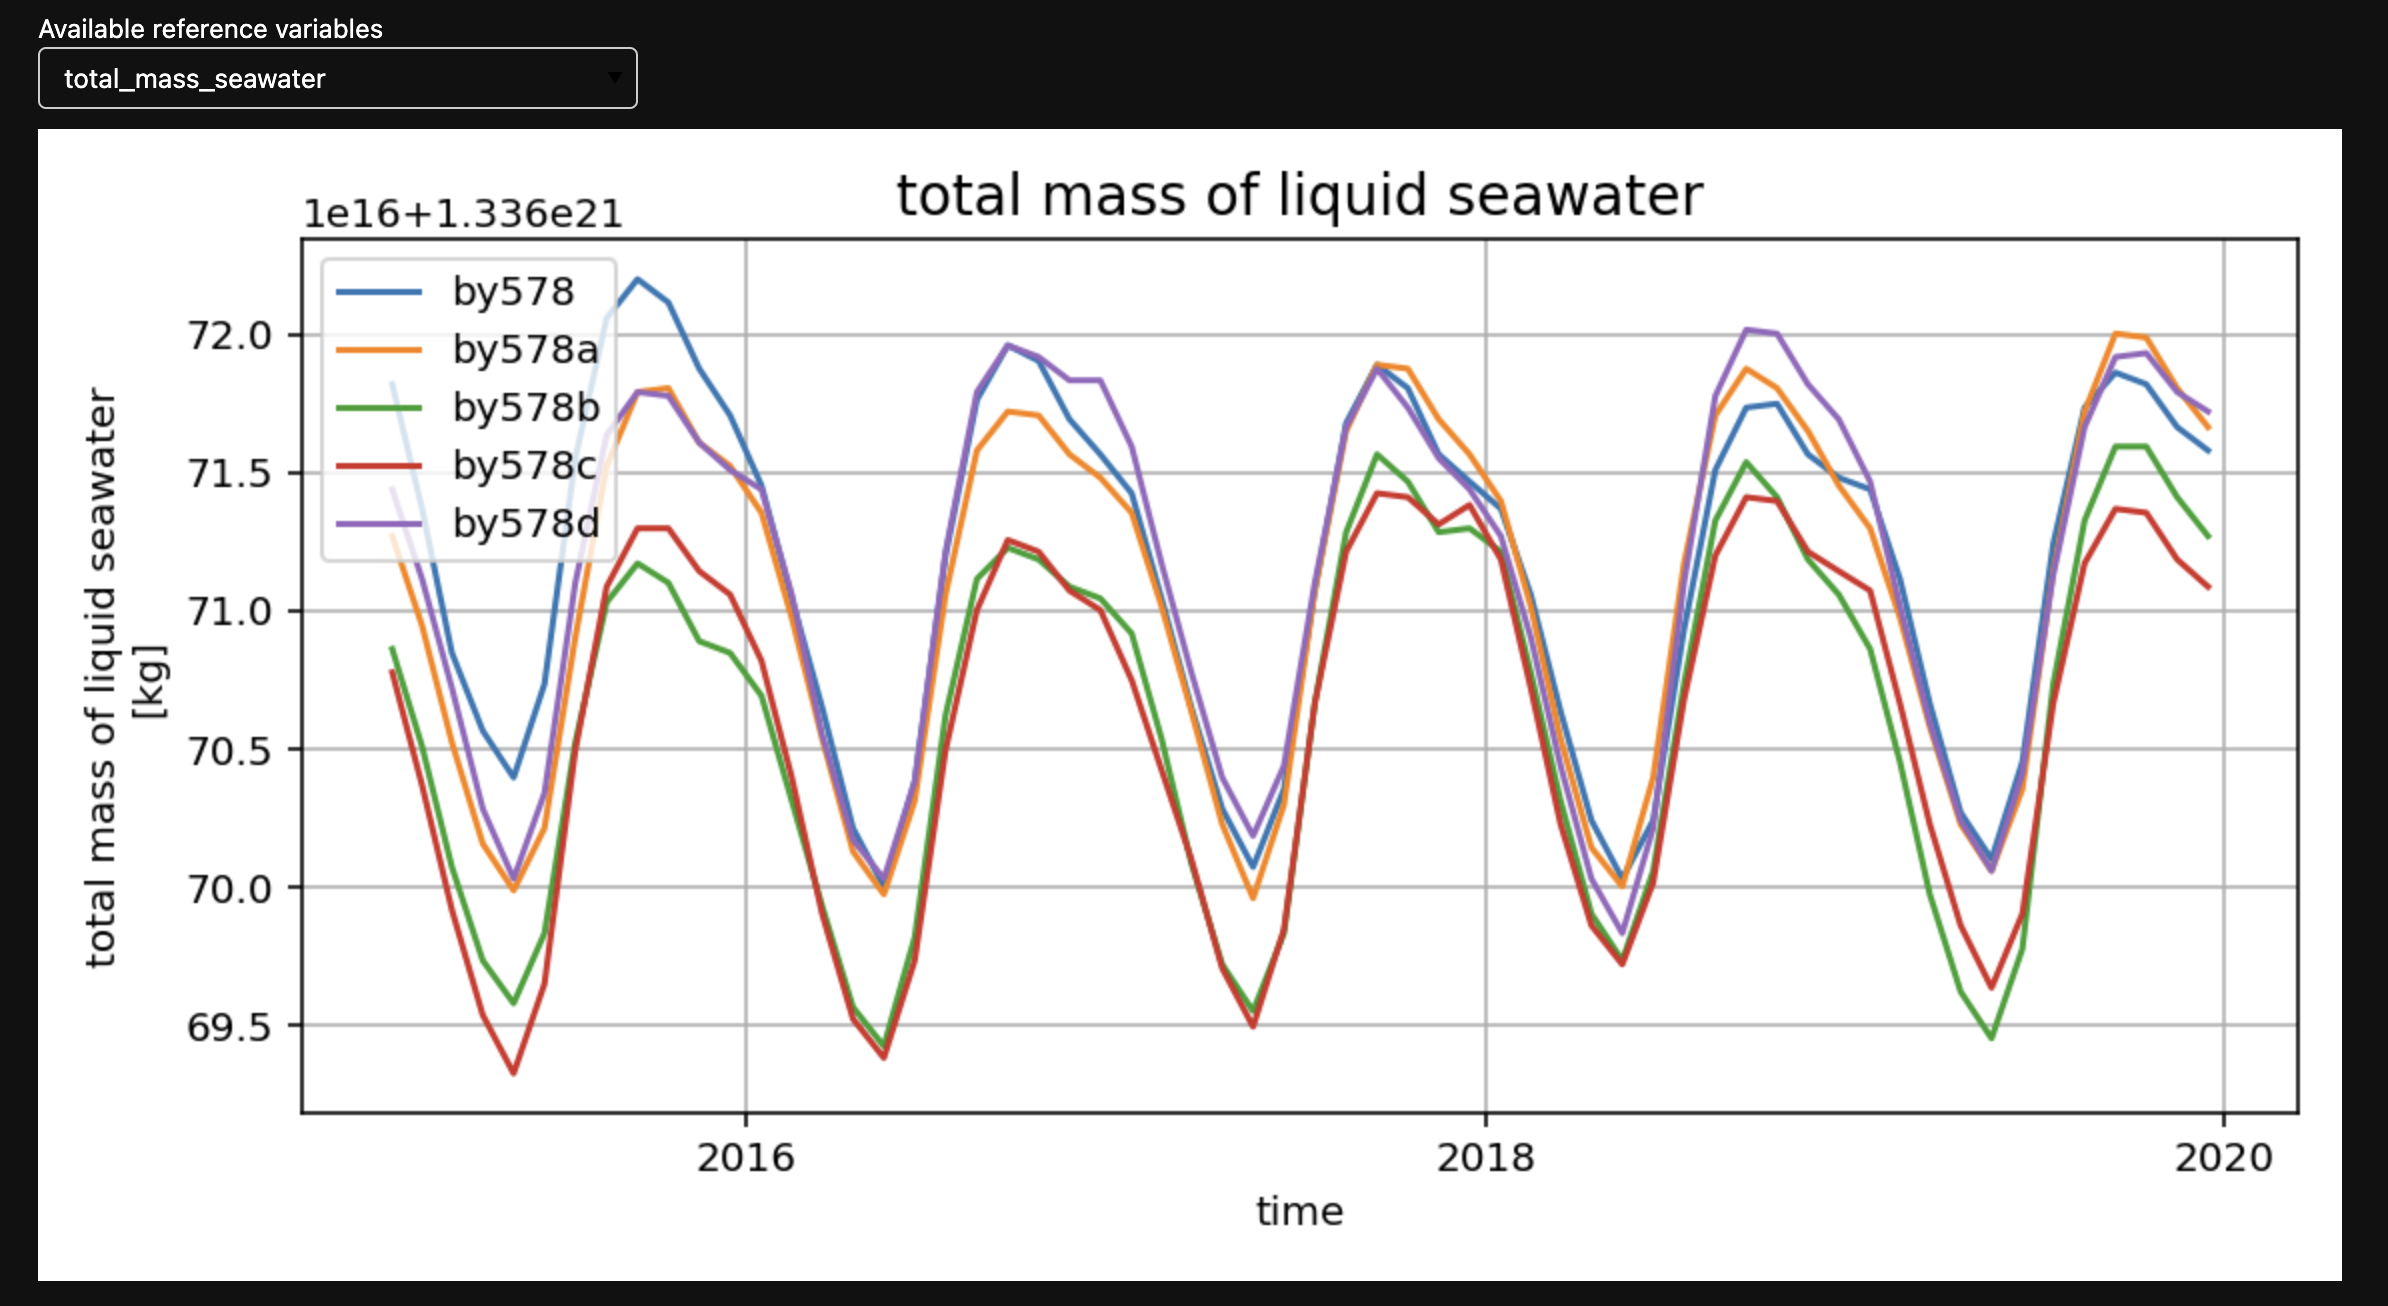
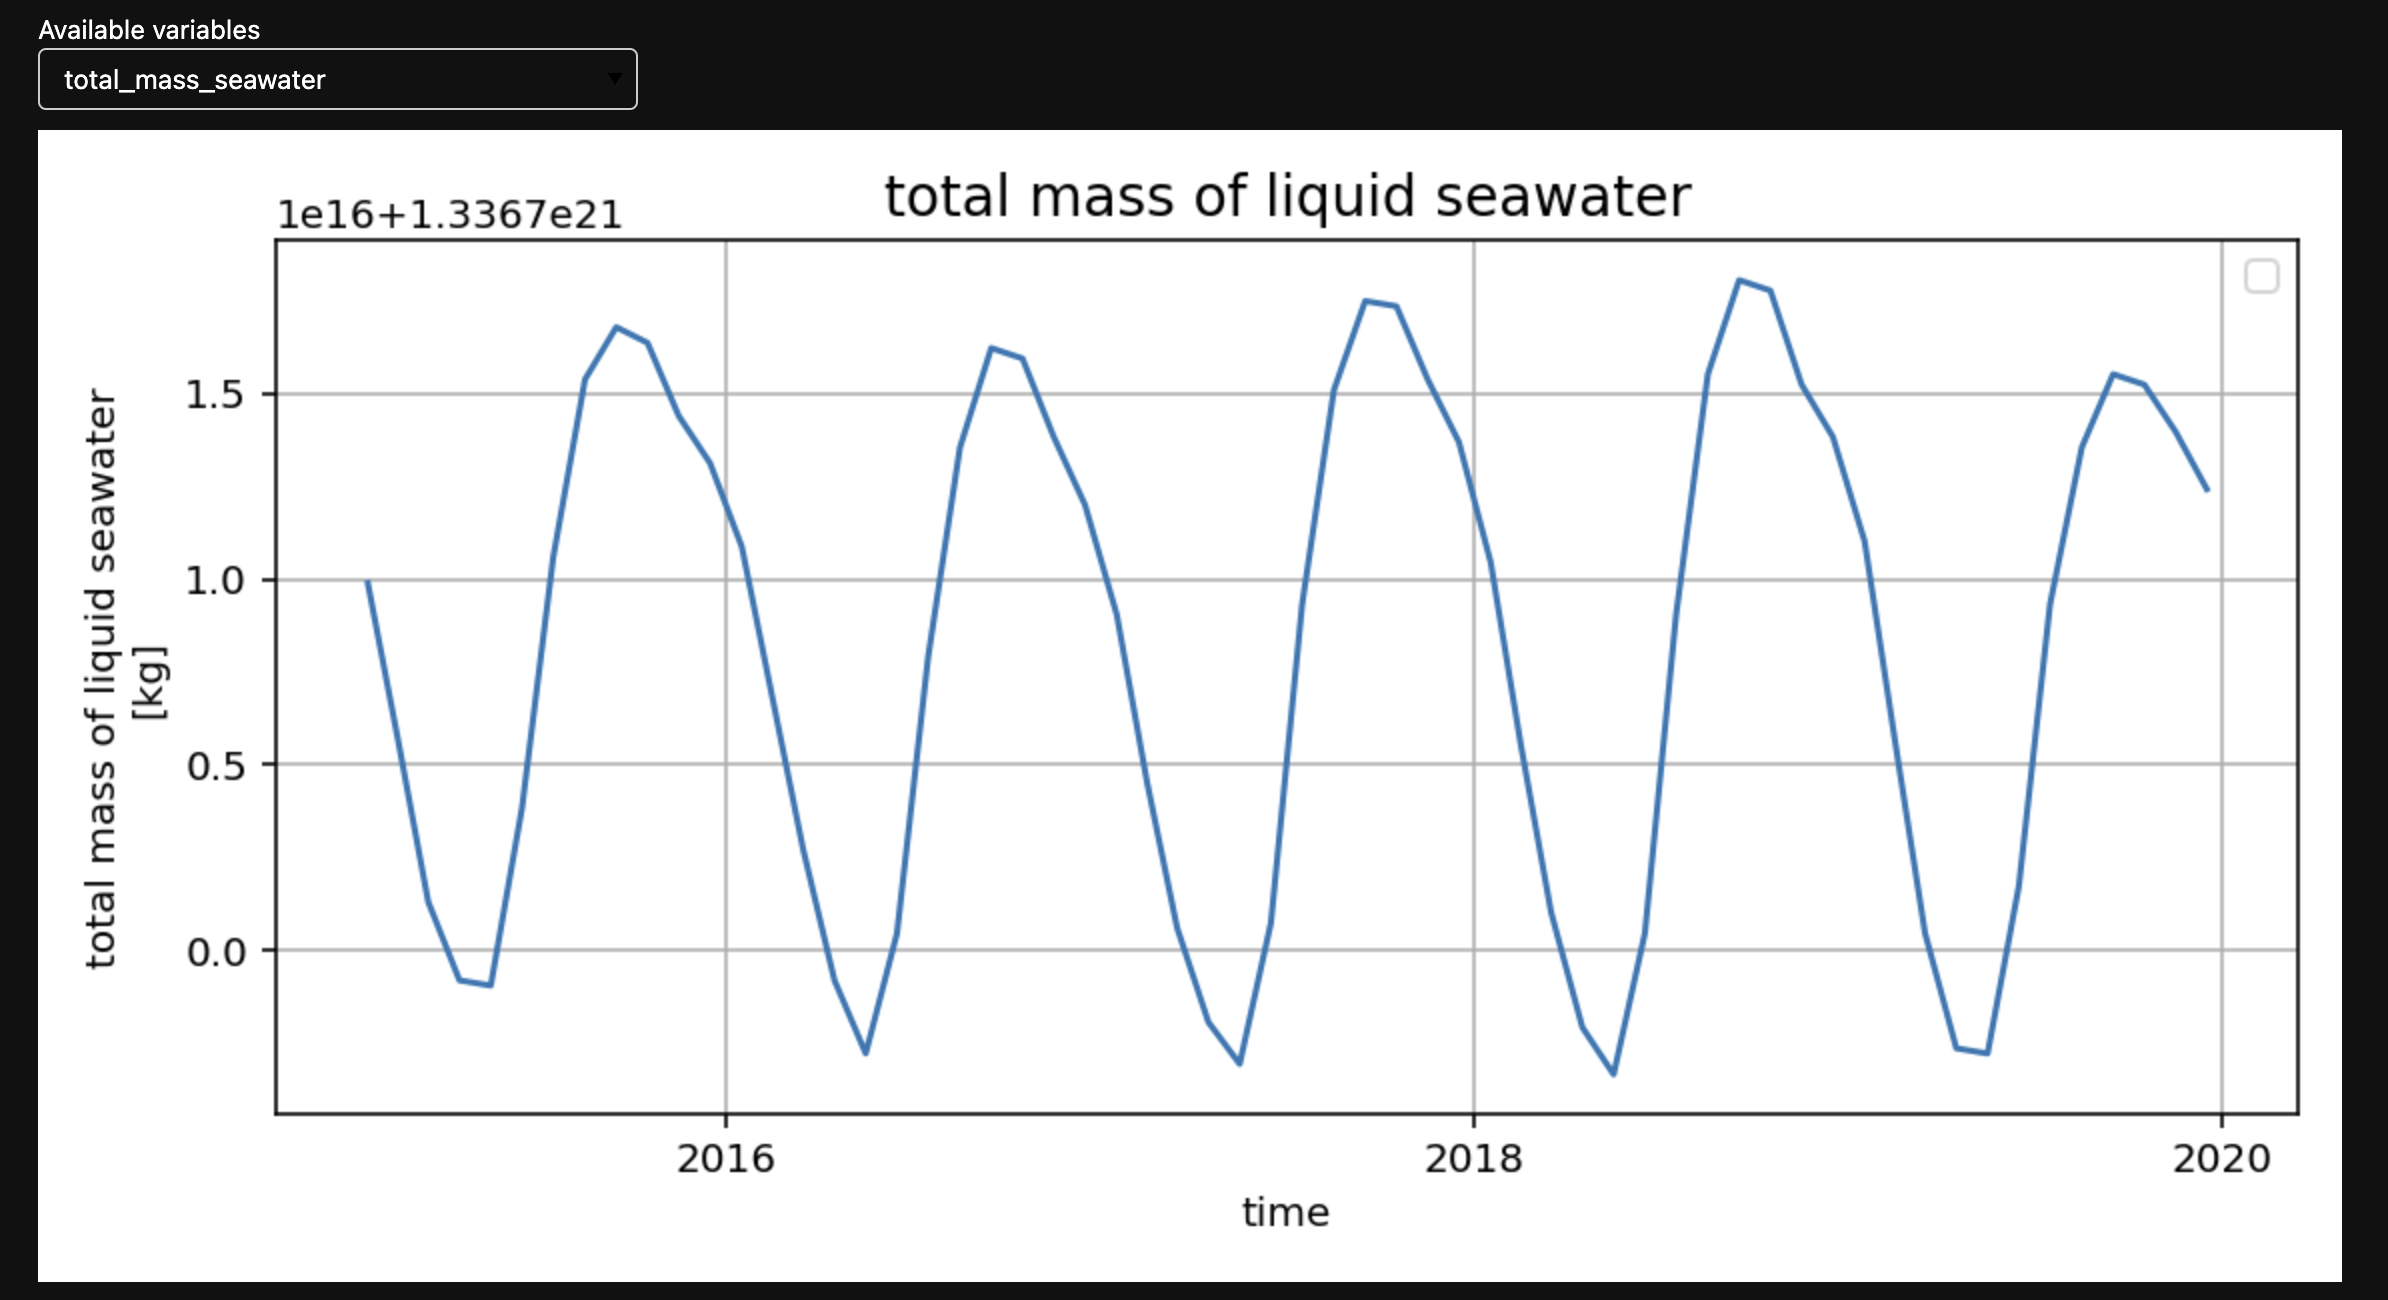
Showcase: Monitoring total seawater mass of an ACCESS-CM2 run
In this showcase, monitoring the progress of an ACCESS Coupled Model 2 (ACCESS-CM2) run will be shown.
To start a session that automatically checks for new model output within a given period of 20 minutes:
import med_diagnostics
session = med_diagnostics.session.CreateModelDiagnosticsSession(model_type='CM2', model_path='path/to/your/live/model/data/output', period=20)
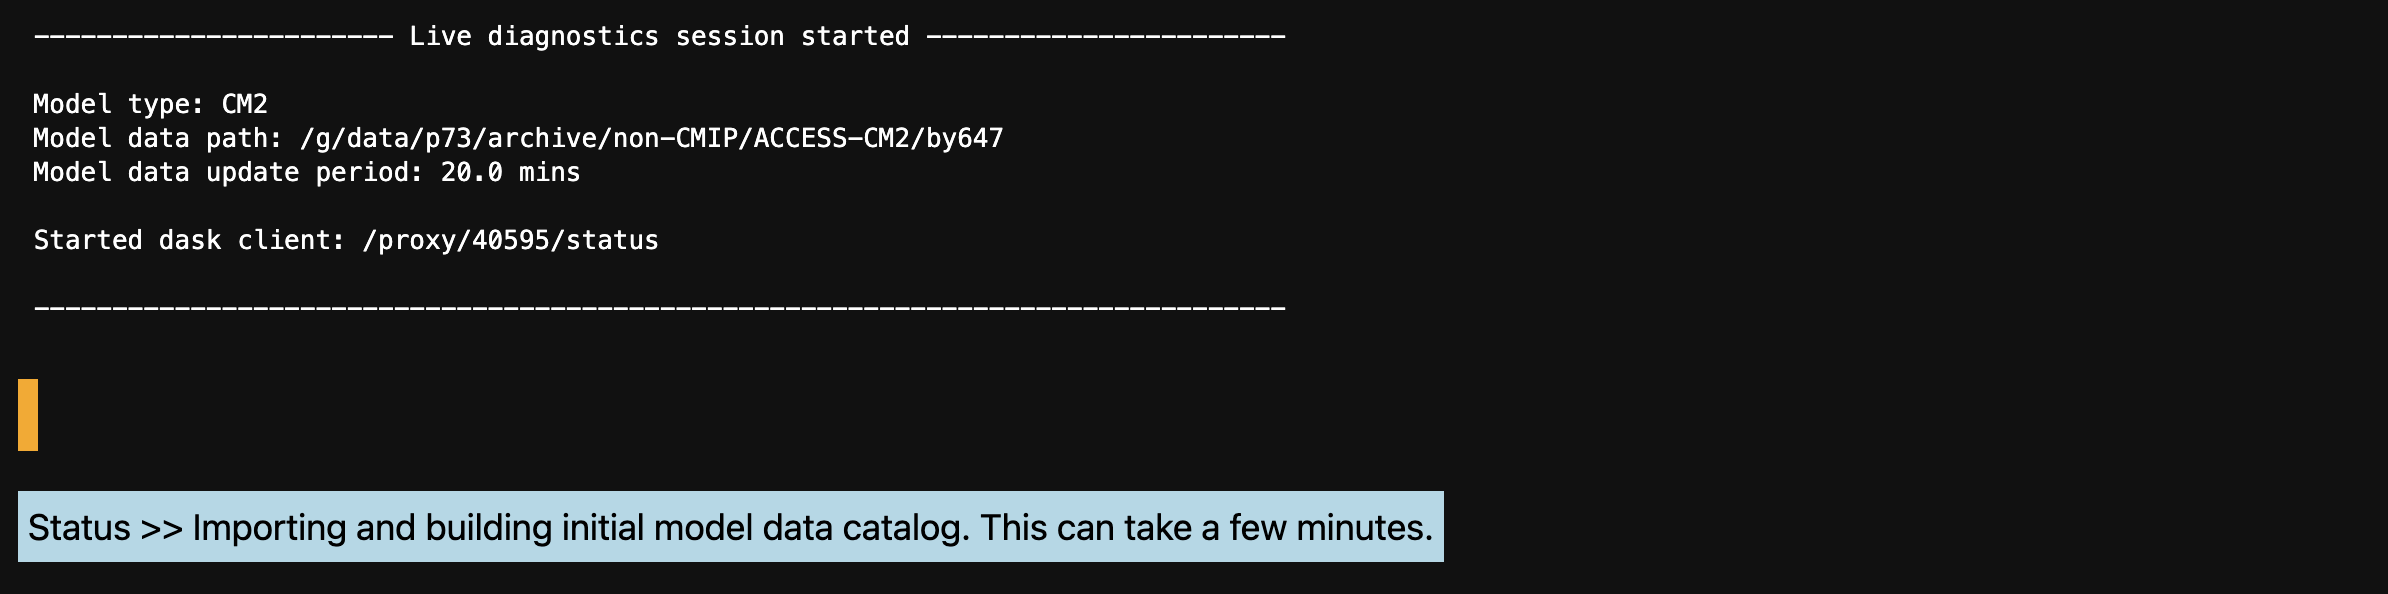
When the session starts, you will see the following session summary:
Once the live model data catalogue has been successfully built, the blue status message will update.
The orange status message will report the time and date of the last live model catalogue build, as shown below:
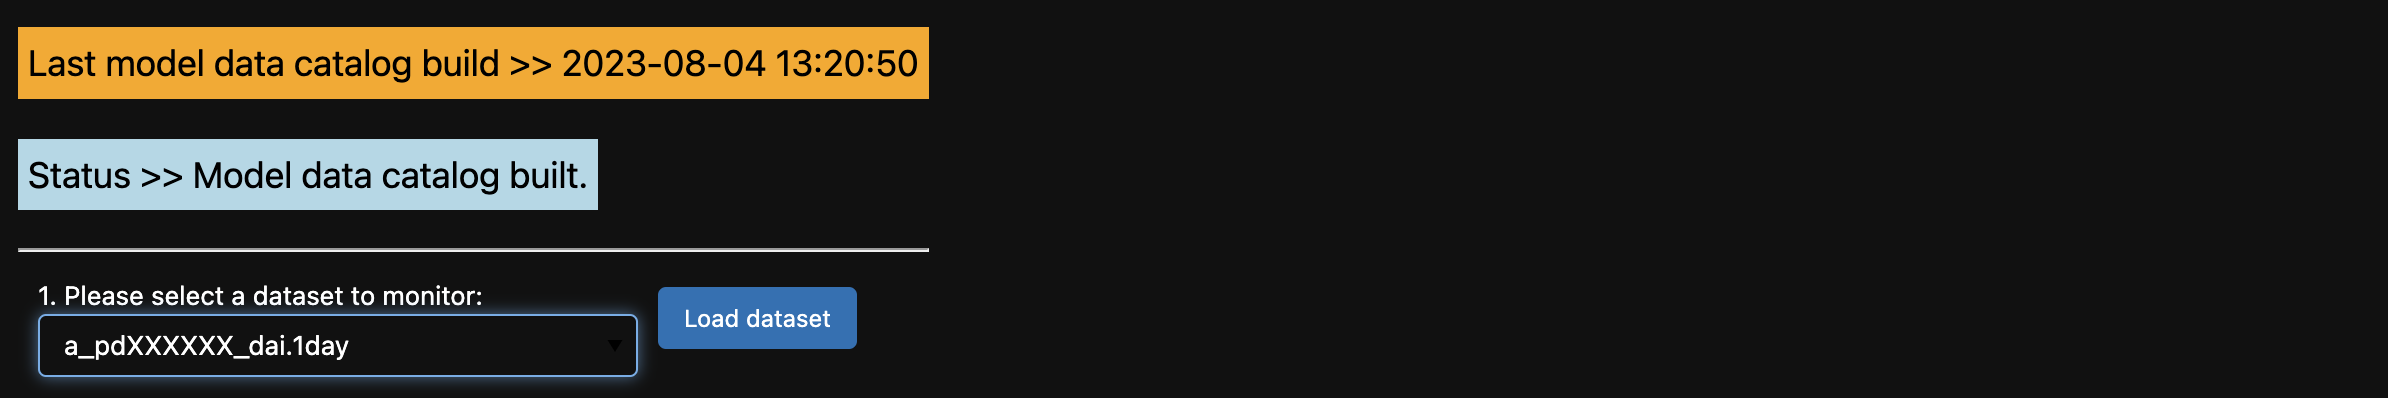
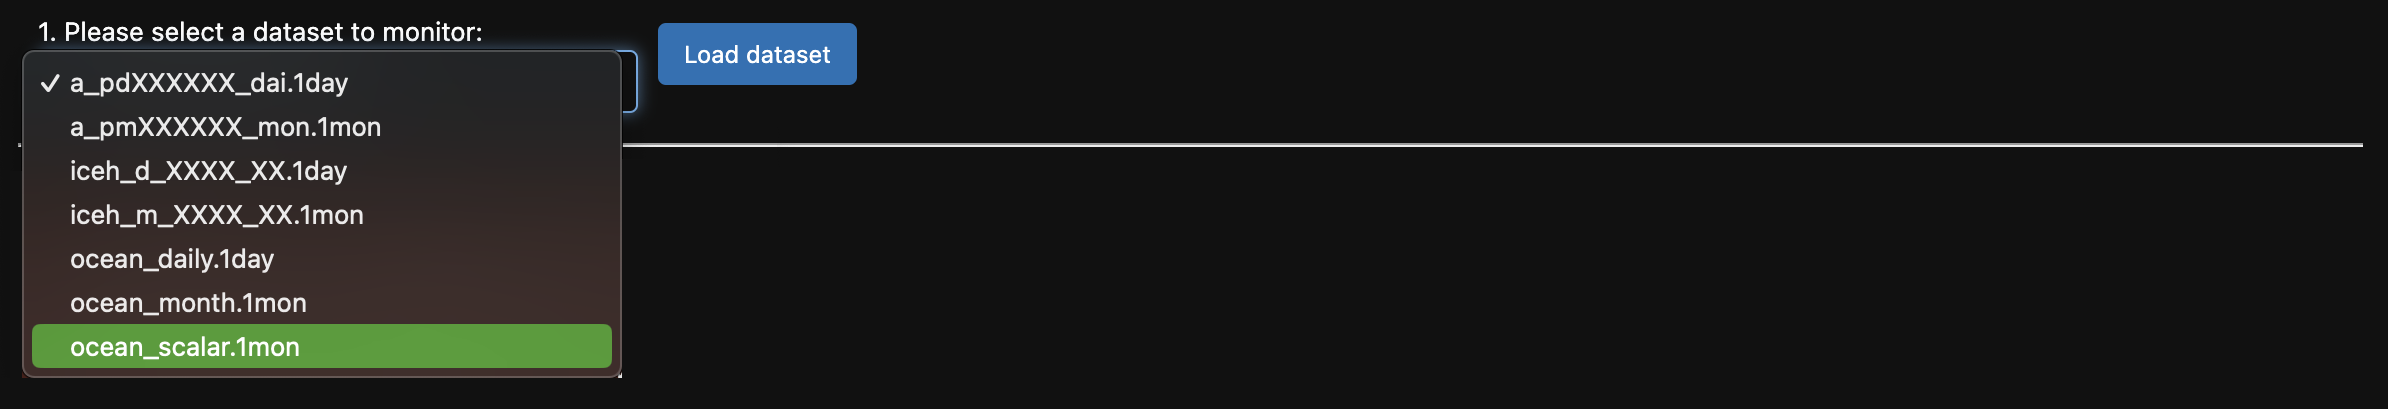
All available datasets for the selected model will be listed in the dropdown menu.
Select the dataset that you want to monitor (e.g., ocean_scalar.1mon) and click Load dataset.
Once loaded, a plot will display the first data variable selected from the list.
Use the dropdown menu to select and plot any available model variables listed.
It is also possible to load and compare legacy data, such as other ACCESS-CM2 models by578 and by578a: