Accessing Model Data on Gadi
To assist with finding and accessing model data on Gadi, ACCESS-NRI has created a catalog called the ACCESS-NRI Intake catalog. This aims to provide a way for Python users to discover and load data across a broad range of climate data products available on Gadi.
For detailed information, tutorials and more, please go to ACCESS-NRI intake catalog documentation.
What is the ACCESS-NRI Intake catalog?
The ACCESS-NRI Intake catalog is essentially a table of climate data products available on Gadi.
Each entry in the table corresponds to a different product, where the columns contain attributes associated with that product (e.g., available models, frequencies and data variables). Users can search on the attributes to find the products that might be useful to them. For example, a user may want to know which data products contain variables X, Y and Z at monthly frequency.
The ACCESS-NRI Intake catalog enables users to find products that satisfy their query and to subsequently load their data without having to know the location and structure of the underlying files.
Example: use ACCESS-NRI Intake to find, load and plot data
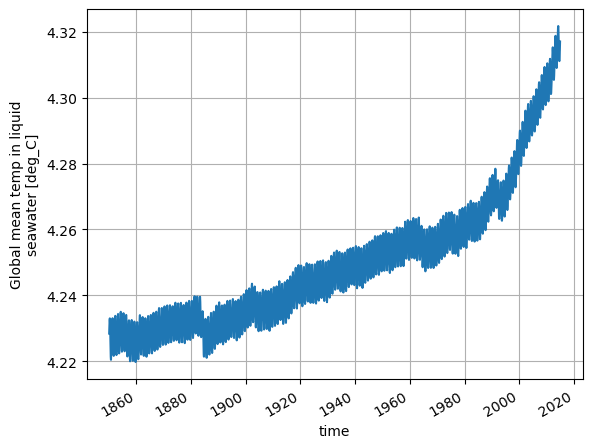
A simple use case of the ACCESS-NRI Intake catalog is a user wants to plot a timeseries of a variable from a specific data product.
For example, the user is interested in plotting a scalar ocean variable called temp_global_ave for an ACCESS-ESM1.5 run called HI_CN_05 (data product). This is an historical run using the same configuration as CMIP6 ACCESS-ESM1.5 historical r1i1p1f1, except that the phosphorus limitation within CASA-CNP is disabled.
First, load the catalog as follows:
import intake
catalog = intake.cat.access_nri
To see all available catalogs, run:
catalog
Now you can load and plot available datasets for the temp_global_ave variable of the HI_CN_05 data product as follows:
import matplotlib.pyplot as plt

# This returns an xarray Dataset
dataset = catalog["HI_CN_05"].search(variable="temp_global_ave").to_dask()

# Plot the data
dataset["temp_global_ave"].plot()
plt.title("")
plt.grid()
